
Lower your internet bill
61% of people overpay for their internet.
Are you one of them?
Unlock exclusive offers in your area!
Call now
[tel]Enter zip code
 Use code: KALA & receive a $50 gift card with your order!
 Are you happy with your Internet service?

About the author
You run Ookla and see 500 Mbps. Not too bad! You run Fast.com and see 180 Mbps. Wait… what?
Your internet provider’s own app shows something else entirely.
If you’ve ever wondered why do speed tests give different results, the short answer is that every speed test measures the connection between your device and one specific server, at one specific moment. No two tools use the same server, path, or method. None of the results are wrong, per se. They’re just measuring different things.
61% of people overpay for their internet.
Are you one of them?
Unlock exclusive offers in your area!
Call now
[tel]Enter zip code
How Do Speed Tests Work?
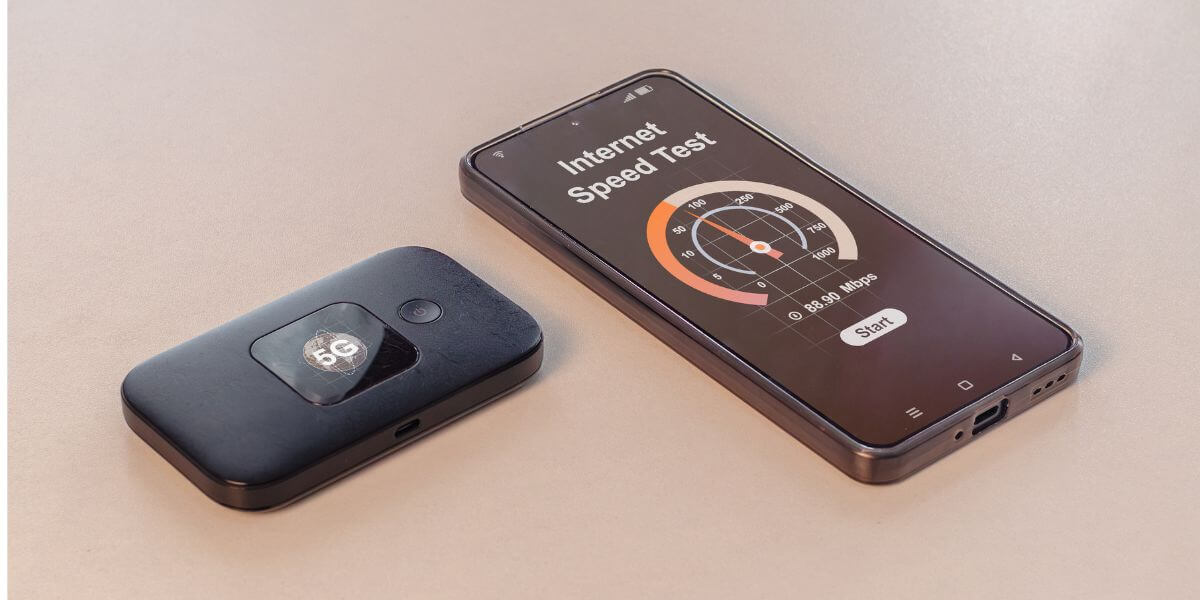
Every speed test follows roughly the same recipe. Your device opens a connection to a test server, downloads a file (and usually uploads one) for several seconds, and calculates how many megabits per second moved during that window.
The differences start with server selection. Ookla’s Speedtest, for example, pings a shortlist of nearby servers chosen by your IP location and automatically connects to whichever one responds with the lowest latency [1].
Fast.com, Waveform, and your ISP’s own tool each run a version of this same idea, but against a different server network, with different timing and thread counts. That single design choice, repeated across a dozen popular tools, is where most of the confusion starts.
Three variables do almost all of the work: which server you connect to, whether you’re on WiFi or Ethernet, and what device you’re testing from.
Speed test server selection is the single biggest reason two tools disagree. Ookla connects you to the nearest low-latency server built specifically for speed testing, which is why it tends to report the highest number. It’s showing you close to the full ceiling of your connection.
Fast.com takes a different approach by measuring your throughput to Netflix’s own content delivery network servers, which reflects real-world streaming performance rather than a best-case lab result [2].
That’s the heart of the Ookla vs. Fast.com accuracy debate. Ookla is closer to “what your line can technically do," while Fast.com is closer to “what your line does for a Netflix stream right now."
An ISP speed test vs. Ookla comparison adds a third wrinkle. Many providers route their in-app or in-browser tests through servers inside their own network. That can be useful for isolating problems (if your ISP’s test looks fine, but everything else looks slow, the issue is probably downstream, not with your ISP), but it isn’t representative of traffic to the broader internet.

Speed Test on WiFi vs. Ethernet
Running a speed test on WiFi vs. Ethernet can produce wildly different numbers even on the exact same tool and server, because a wireless test measures the bottleneck of the wireless hop, not your actual connection speed.
Ookla’s own Speedtest Intelligence data put typical home WiFi performance at just 30-40% of wired Ethernet speeds during a recent quarter [3], and that gap gets bigger with distance from the router, wall and floor interference, and older WiFi standards. If you want a definitive read on what you’re paying for, always run the test on a device plugged directly into Ethernet.
Even on a perfect wired connection, an older laptop or phone can cap your result well below your plan speed if its network card, port, or processor can’t sustain full throughput. A five-year-old device with a 100 Mbps Ethernet port will never show more than 100 Mbps, no matter how fast your plan is.
Which Speed Test Is Most Accurate for What You’re Testing?
There’s no single most accurate internet speed test, and the best internet speed test for you depends on the question you’re actually asking:
| Goal | Best tool |
| Find your connection’s true ceiling | Ookla, on Ethernet |
| Estimate real streaming performance | Fast.com |
| Check for lag-causing bufferbloat | Waveform’s bufferbloat test [4] |
| Rule out ISP-side problems | Your ISP’s own speed test |
If gaming or video calls feel laggy even when your download number looks fine, bufferbloat—not raw speed—is the more likely culprit.
If every test you run comes back below what you’re paying for, work through the variables above first: switch to Ethernet, test on a newer device, and try more than one tool.
Context matters too. The FCC’s benchmark for what counts as broadband jumped from 25/3 Mbps to 100/20 Mbps in 2024 specifically because providers’ advertised speeds and actual delivered speeds don’t always match consumer expectations [5]. Plans are also typically sold as “up to" a certain speed rather than guaranteed—see our breakdown of why ISPs advertise “up to" speeds for what that language actually obligates a provider to deliver.
If you’ve ruled out WiFi, device, and server issues and you’re still consistently short, the problem is likely on the ISP’s side, such as network congestion, an aging line, or a plan that was never available at your full advertised speed to begin with. It’s worth checking what’s actually available at your address before assuming your current plan is the problem.
That’s also a good moment to compare internet providers in your area. If your test results reveal you’re stuck on a slower, pricier tier than what’s now available, running a quick internet comparison can save real money.
Use the zip code tool below to compare internet plans, internet prices, and the best internet providers serving your address side by side, so you can see the best internet in your area before you commit to anything.
61% of people overpay for their internet.
Are you one of them?
Unlock exclusive offers in your area!
Call now
[tel]Enter zip code
Because live network conditions change second to second. Server load, how many devices are active on your network, and even normal internet traffic congestion can shift the number by 10-20% between runs. Running a test three times and averaging the results is more reliable than trusting any single result.
The test itself usually isn’t broken — it’s measuring exactly what it’s designed to measure. “Inaccurate" results almost always trace back to one of the variables above: a WiFi connection instead of Ethernet, an older device, a distant or congested server, or testing during peak evening hours when everyone in your area is online at once.
Test on Ethernet first to establish your connection’s true ceiling, then test on WiFi to see what you’re actually getting on your everyday devices. The gap between the two tells you whether a slow speed test is an internet problem or a WiFi problem.
Streaming in 4K generally needs about 25 Mbps per stream, so most modern plans clear that easily. For gaming, raw speed matters far less than low, stable latency and low bufferbloat — a 50 Mbps connection with clean latency will feel better than a 500 Mbps connection with heavy bufferbloat under load.
[1] A Comparative Analysis of Ookla Speedtest and Measurement Labs Network Diagnostic Test (NDT7).
[2] Netflix. “FAST.com Now Measures Latency and Upload Speed."
[3] Ookla. “Improve Wi-Fi in the Home."
Do you want to leave a review for AT&T Internet?
About the author

Infinity Sales Group, LLC