
Reduce tu factura de Internet
El 61% de las personas paga de más por internet.
¿Eres uno de ellos?
¡Desbloquea ofertas exclusivas en tu zona!
Llama ahora
[tel]Introduzca código postal




















 ¡Usa el código KALA y recibe una tarjeta de regalo de $50 con tu pedido!
 ¿Estás satisfecho con tu servicio de Internet?

Acerca del autor.
Ingrese su código postal para encontrar todos los proveedores de servicios de Internet disponibles en su área
Habla con un especialista para desbloquear ofertas en tu área
[tel]En Estados Unidos, el lugar donde vives sigue siendo un factor determinante para tener acceso a internet doméstico rápido y fiable. Y en algunos estados, la brecha entre los barrios mejor conectados y el resto del estado es mayor que nunca.
Construimos el Índice estatal de Internet de 2026 Para responder a una pregunta sencilla: ¿qué estados realmente ofrecen banda ancha en los hogares y cuáles están dejando atrás a la gente? El índice califica a los 50 estados, Washington DC y Puerto Rico Utilizando la propia base de datos de la FCC, el registro del gobierno federal que detalla, ubicación por ubicación, dónde los proveedores de internet informan que ofrecen servicio, y el mismo conjunto de datos que respalda el programa federal de banda ancha BEAD de 42.45 millones de dólares.
Sigue leyendo para ver cómo se compara tu estado.
North Dakota Cuenta con el mejor servicio de internet doméstico del país, con una puntuación de 94.1 sobre 100. El 99.2% de los hogares tienen acceso a internet de alta velocidad, y prácticamente no hay diferencias entre el acceso en la ciudad y en el campo. Alaska ocupa el último lugar con una puntuación de 0 sobre 100, el único estado que ocupa el peor puesto del país en todas las métricas que medimos. Completando los cinco primeros puestos están Connecticut, Tennessee, Washington DC y New Jersey; los cinco últimos son Alaska, New Mexico, Idaho, Montana, y Wyoming.
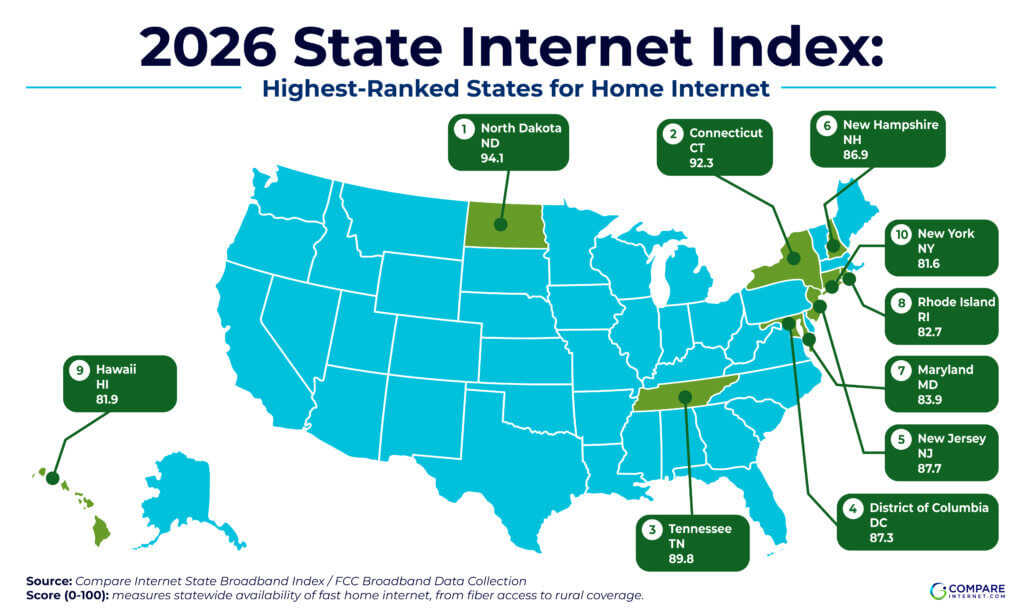
North Dakota encabeza la lista por una razón que la mayoría de la gente no esperaría: no es un estado densamente poblado y urbano; es un estado mayoritariamente rural que simplemente construyó una infraestructura consistente en todas partes. 99.2% de North Dakota Las viviendas tienen acceso a alta velocidad, y la brecha entre sus ciudades y su campo es de solo 1 punto porcentual, la más pequeña del país junto con Connecticut (Puntos 0.2).
Connecticut, Tennessee, Washington DC y New Jersey Completan los cinco primeros puestos todos los estados donde el acceso a internet de alta velocidad supera el 97% y la brecha entre zonas urbanas y rurales se mantiene en un solo dígito. Rhode Island Merece una mención especial también el hecho de que, a pesar de ser el estado más pequeño en superficie terrestre, tiene el mayor acceso a fibra óptica de todo el país, con un 83.2%.
Lo que estos estados tienen en común no es la riqueza ni la densidad de población. Es la coherencia. No solo conectaron sus ciudades; conectaron todo el territorio.
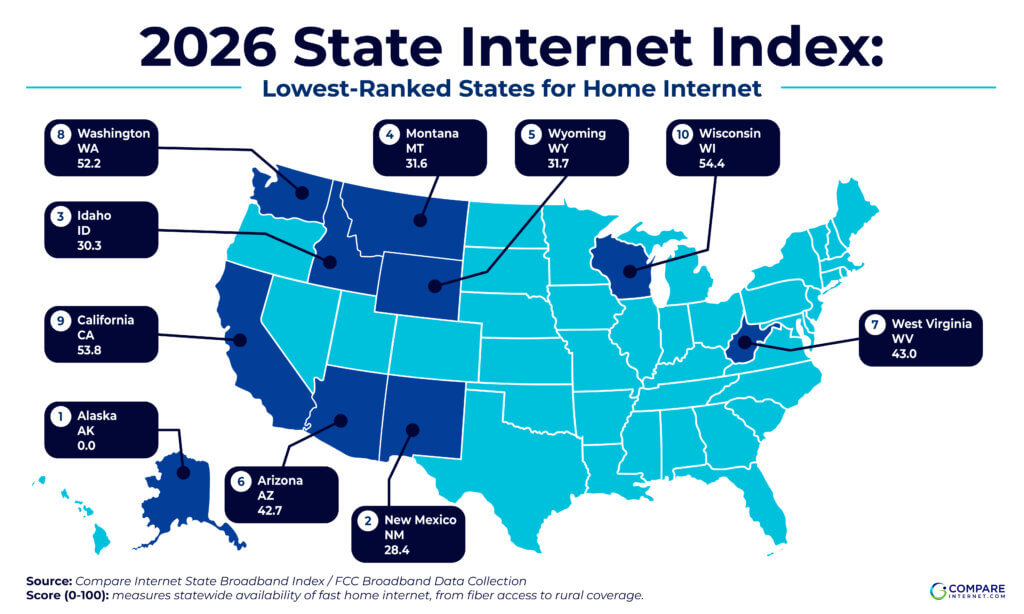
Al final de la lista, Alaska Es un caso aislado. Es el único estado del país que ocupa el último lugar en todas las métricas que medimos: solo un 71.5 % de acceso a internet de alta velocidad, un 14.2 % de acceso a fibra óptica, un 12.5 % de acceso a gigabit y una diferencia de 60 puntos entre sus ciudades y el resto del país. New Mexico, Idaho, Montana, y Wyoming Se une a él en el grupo de los cinco últimos, todos estados donde la vasta geografía rural ha superado el desarrollo de infraestructuras.
Pero la verdadera sorpresa en los últimos 10 no es un estado rural en absoluto. Es California (44th) y Washington (45.º), dos estados que albergan algunas de las mayores empresas tecnológicas del mundo. En ambos estados, la cobertura urbana supera el 96 %, pero la cobertura rural desciende a aproximadamente el 52-57 %. Incluso sus ciudades dependen más del cable tradicional que de la fibra óptica: urbana California El 93.9% de los hogares tienen cable, pero solo el 41.8% tienen fibra, y en las zonas urbanas... Washington Se observa una distribución casi idéntica (96.6 % cable frente a 41.2 % fibra). Resulta que la reputación del sector tecnológico no se traduce automáticamente en una sólida infraestructura de banda ancha doméstica a nivel estatal.
Wisconsin (43º) y West Virginia Completan una lista de los 10 peores, definida menos por "no tener internet en absoluto" y más por "tener internet que se detiene en los límites de la ciudad".
Si nos fijamos únicamente en el promedio general de un estado, no podremos detectar dónde están las verdaderas desigualdades. Idaho, New Mexico, Wyoming, Colorado, y California Todos muestran diferencias superiores a 44 puntos porcentuales entre sus ciudades y sus zonas rurales, lo que significa que las probabilidades de que un residente obtenga un servicio de alta velocidad todavía dependen en gran medida de en qué lado del límite del condado viva:
La fibra óptica presenta una situación similar a nivel nacional. Es la tecnología que la mayoría de los proveedores y legisladores señalan como el futuro del internet doméstico. Sin embargo, aún llega a poco más de la mitad de los hogares estadounidenses (55.8%), mientras que las redes de cable tradicionales siguen ofreciendo la mayoría de las conexiones de alta velocidad, incluso en estados que muchos considerarían ya con una infraestructura de red completa.
Por eso, este índice mide la infraestructura cableada (fibra, cable, DSL) en lugar de las cifras de cobertura más amplias de la FCC, que incluyen el servicio satelital. Según esta última perspectiva, casi todos los estados muestran una disponibilidad superior al 99 %, cifra impulsada en gran medida por los proveedores satelitales que afirman llegar a casi cualquier lugar. Esto disimula las diferencias reales entre los estados, que es precisamente lo que este índice busca revelar.
«El índice demuestra que el tamaño geográfico de un estado o unos promedios estatales sólidos no garantizan una infraestructura uniforme», afirmó Caroline Lefelhoc, editora de contenido de Compare Internet. «Nos centramos deliberadamente en la infraestructura cableada porque la cobertura satelital suele ocultar las deficiencias de servicio localizadas. En definitiva, el estudio demuestra que cuando una vasta extensión geográfica se combina con redes físicas limitadas, las zonas sin acceso a banda ancha son inevitables, independientemente de cómo se ponderen las métricas».
La diferencia entre el promedio de un estado y una dirección específica es precisamente la razón por la que "¿hay banda ancha disponible en mi estado?" es la pregunta equivocada. La correcta es "¿qué hay realmente disponible en mi dirección?". Esto es cierto tanto si estás en un estado de primer nivel como North Dakota o uno de los peor clasificados como Alaska: La cobertura varía bloque por bloque, no solo estado por estado.
Introduce tu código postal para ver todos los proveedores de internet, planes y velocidades disponibles en tu zona, no solo el promedio estatal.
La puntuación de Internet (0-100) se basa completamente en los datos de la recopilación de datos de banda ancha de la FCC, ponderando cuatro medidas de banda ancha residencial por cable: acceso de alta velocidad a 100/20 Mbps (35 %), acceso a fibra (25 %), acceso Gigabit a 1000/100 Mbps (20 %) y equidad urbano-rural, la diferencia entre las tasas de acceso de alta velocidad urbanas y rurales de un estado (20 %). Cada métrica se normaliza con respecto a las 52 jurisdicciones antes de la ponderación, por lo que las cifras brutas de ningún estado pueden distorsionar la escala. Sometimos esta ponderación a pruebas de estrés con cuatro esquemas alternativos (ponderación igualitaria, con mayor énfasis en la equidad, solo en la velocidad y con mayor énfasis en la fibra); en cada versión, los 5 estados con mejor y peor puntuación se mantuvieron prácticamente iguales, con correlaciones de rango entre 0.89 y 1.00 con respecto a la metodología principal. La clasificación mide dónde informan los proveedores que se ofrece el servicio residencial, no las tasas de adopción, los niveles de suscripción ni los resultados de las pruebas de velocidad en condiciones reales.
Conjunto completo de datos y puntuaciones estado por estado: Datos del Índice de Internet del Estado
¿Quieres dejar una reseña para? AT&T ¿Internet?
Acerca del autor.
Ingrese su código postal para encontrar todos los proveedores de servicios de Internet disponibles en su área
Habla con un especialista para desbloquear ofertas en tu área
[tel]
Infinity Sales Group, LLC